The Continuous Mortality Investigation (CMI) provides authoritative and independent mortality and sickness rate tables for actuaries advising UK life insurers and pension funds. It operates as a not-for-profit private company that is wholly owned by the Institute and Faculty of Actuaries (IFoA). The CMI Mortality Projections Model (the “CMI Model”) is widely used by actuaries in the financial management of UK pension schemes and life insurance companies.
This note accompanies the release of the latest version of the CMI Mortality Projections Model, CMI_2023. It describes the CMI Model and contains background information on recent mortality experience. We include a section on “mortality terminology” at the end of this FAQ to explain the terms used.
The CMI is funded by subscriptions from commercial users, and most CMI outputs are only available to Subscribers, and to academics and researchers for non-commercial use. This note is publicly available and its use is subject to the Disclaimer and Copyright Notice in the back page
We strongly encourage actuaries using CMI_2023 to refer to the more detailed results in Working Paper 189 and its associated outputs, which are restricted to authorised users. Details of how to access the CMI’s research can be found on the CMI section of the IFoA’s website.
Key findings
Standardised mortality rates in England & Wales in 2023 were the third lowest on record, with only 2014 and 2019 having lower mortality. The CMI is providing frequent updates on mortality through its regular mortality monitor.
Mortality in 2020 and early-2021 was volatile, making it difficult to assess the longer-term impact of the coronavirus pandemic on mortality. The CMI took the view that while mortality experience in 2020 and 2021 would affect actuarial calculations, it was likely to be an outlier and not indicative of the future path that mortality rates will follow. For this reason, the standard versions of CMI_2020 and CMI_2021 placed no weight on the data for these years when projecting mortality rates.
Since mid-2021, mortality has been less volatile than earlier in the pandemic. Mortality has returned to a level similar to the five years immediately before the pandemic with fewer deaths due to COVID-19. This suggests that more recent mortality may be indicative of future mortality to some extent. Given that, we made some allowance for the mortality experience from 2022 onwards when calibrating CMI_2022 and CMI_2023.
Placing full weight on mortality data for 2022 and 2023 would lead to falls in projected life expectancy that most users of the Model would consider to be excessive. Because of this, the standard version of CMI_2023 has weights of 15% for data in 2022 and 2023. However, users can modify the Model to vary the weight for any year to reflect their own views. We note that weights have a non-linear impact on life expectancy and using weights of 15% for 2022 and 2023 in CMI_2023 leads to life expectancy being slightly closer to life expectancies from using 100% weights for each year than to life expectancies from using 0% weights for each year.
The data used to calibrate CMI_2022 reflected our estimated revisions to population estimates for 2012 to 2020 in light of initial results of the 2021 census available at the time of publication. The CMI_2023 dataset fully reflects the impact of the 2021 census on population estimates now that the ONS has published its own revisions for 2012 to 2020.
The standard version of CMI_2023 produces cohort life expectancies at age 65 that are about 5 weeks lower for males and 2 weeks lower for females than in CMI_2022.
Mortality improvements are not the same for everyone. Over the period 2011-2020, people aged between 65 and 89 living in less-deprived areas of England & Wales have experienced mortality improvements around 1.5% a year higher than those in more-deprived areas
FAQ sections
- The latest version of the CMI Model, CMI_2023
- Historical mortality in England & Wales
- How the CMI Model works
- Mortality terminology
1. The latest version of the CMI Model, CMI_2023
What happened to mortality in 2020 to 2023?
Standardised mortality rates in England & Wales compared to the 2015-2019 average were around 10% higher in 2020, 4% higher in 2021, 0.5% higher in 2022 and 0.5% lower in 2023.
How has the CMI Model changed compared to CMI_2022?
In normal circumstances, we update the CMI Model each year to use more recent mortality data. We have updated the dataset for CMI_2023 to use data for calendar years 1983-2023, rather than 1982-2022 for CMI_2022. The update to the dataset includes revisions to population data for 2012-2022 following further results from the 2021 census, as well as our own estimate for 2023.
The impact of the coronavirus pandemic means that mortality in 2020 and 2021 is unlikely to provide a good guide to future mortality. Because of this, we put no weight on data for those years when calibrating CMI_2021.
While mortality in 2022 and 2023 has also tended to be higher than pre-pandemic levels, it has been less volatile and may be indicative of future mortality to some extent. Given that, we placed 25% weight on data for 2022 when calibrating CMI_2022 and placed 15% weight on data for 2022 and 2023 when calibrating CMI_2023. We note that weights have a non-linear impact on life expectancy, and using weights of 15% for 2022 and 2023 in CMI_2023 leads to life expectancy being slightly closer to life expectancies from using 100% weights for each year than to life expectancies from using 0% weights for each year. Similarly, the 25% weight placed on data for 2022 in CMI_2022 resulted in life expectancies broadly half-way between those using 100% and 0% weights.
What does CMI_2023 mean for cohort life expectancy?
CMI_2023 and CMI_2022 have similar expected mortality improvements in the short to medium term.
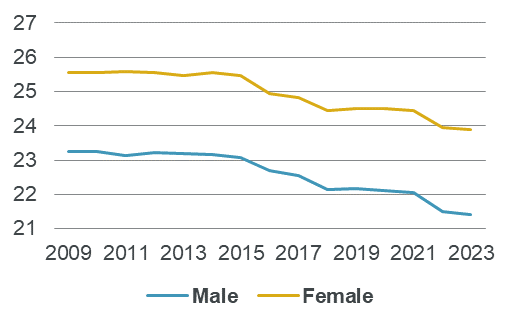
Chart A illustrates the progression of cohort life expectancy for members of defined benefit pension schemes since the first version of the CMI Model, CMI_2009. CMI_2023 produces similar cohort life expectancies to CMI_2022. At age 65, cohort life expectancy is around 5 weeks lower for males and 2 weeks lower for females than in CMI_2022.
Cohort life expectancy is a subjective measure that depends on assumed future changes in mortality. Although Chart A shows that cohort life expectancy has typically been falling in recent years, this does not necessarily mean that mortality rates were increasing throughout the period – instead it typically reflects lower projected rates of future mortality improvement.
Chart A: Cohort life expectancies as at 1 January 2024 at age 65 from CMI_2023 and earlier versions
How are these cohort life expectancy figures calculated?
In order to calculate cohort life expectancies, the CMI Model requires its users to make assumptions about current mortality rates and the long-term rate of mortality improvements:
- We have used an illustrative long-term rate of 1.5% a year, as this is a commonly-used value, but the CMI does not comment on its appropriateness or make a recommendation.
- We have used the latest pension scheme mortality tables, S4PMA and S4PFA. These lead to higher life expectancy than mortality tables for the general population
2. Historical mortality in England & Wales
How has mortality changed in the past?
Chart B shows standardised mortality rates (SMRs, see the “mortality terminology” section below for further information) in the general population of England & Wales from 1983 to 2023, corresponding to the data used to calibrate CMI_2023. Standardised mortality rates fell markedly between 1983 and 2019, although the fall in mortality rates was modest between 2011 and 2019. Mortality was notably higher in 2020 and 2021 than in the years immediately before the pandemic.
Chart B: Standardised mortality rates since 1983
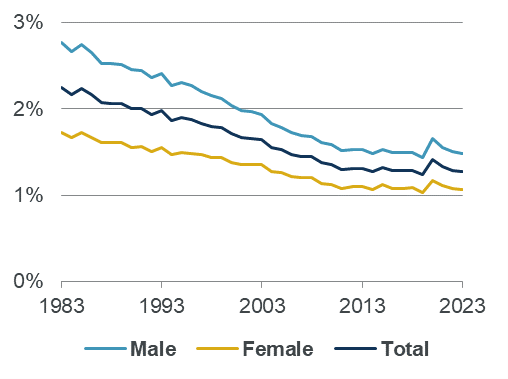
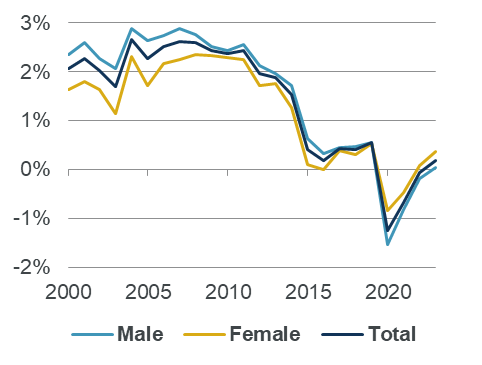
Chart C shows mortality improvements, based on SMRs, for recent five-year periods (e.g. the point for 2023 is the average annual improvement between 2018 and 2023). Mortality improvements for individual years can be very volatile because of short-term effects such as flu and cold winters, as well as the coronavirus pandemic, so we use five-year averages to reduce the impact of these short-term variations and show the trend more clearly. Average mortality improvements were above 2% a year for most of 2002-2011, but fell to around 0.5% a year for periods ending in 2015-2019. The exceptional nature of the coronavirus pandemic led to five-year average improvements being negative for 2015-2020, 2016-2021 and 2017-2022, and close to zero for 2018-2023.
Chart C: Standardised mortality improvements (five year averages) since 2000
How do mortality improvements vary between different groups of people?
Analysis of data published by the Office for National Statistics (ONS) shows that people aged 65-89 living in less-deprived areas of England & Wales:
- have higher life expectancy than those in more-deprived areas; and
- between 2001 and 2020 have experienced mortality improvements about 1.5% a year higher on average (i.e. life expectancy of individuals living in less-deprived areas has been increasing at a higher rate than for people in more-deprived areas).
Pension scheme members and insurance company policyholders tend to be from less deprived areas on average, so may be expected to experience higher mortality improvements than the general population.
Why did mortality improvements fall after 2011?
There has been considerable debate about the reasons for lower mortality improvements between 2011 and 2019, before the pandemic.
Most actuaries expected some slowdown in mortality improvements as some of the factors that led to the previous high improvements could not persist. In particular, a large part of the high mortality improvements in the decades before 2011 came from reductions in deaths from circulatory diseases, such as heart attacks and strokes. As the proportion of deaths from circulatory diseases fell, subsequent reductions could not contribute as much to overall mortality improvements. A higher proportion of deaths are now caused by cancer and dementia, which have shown lower mortality improvements in recent years.
However, the sudden change around 2011 suggests that other factors were involved. For example, economic conditions are likely to have played a part, with GDP falling by over 6% between Q1 2008 and Q1 2009 and subsequently showing lower growth than in previous decades. This has contributed to lower growth in government spending on health and social care than in the preceding period, which, combined with an aging population more dependent on these services, may have affected mortality rates
3. How the CMI Mortality Projections Model works
Why does the CMI produce the CMI Model?
Actuaries need to make assumptions about mortality rates to help manage pension schemes and insurance companies. They typically do this in two stages – first assessing current mortality rates, and then considering how these rates may change over time. The CMI Model relates only to the second stage.
Many UK pension schemes and insurance companies use the CMI Model either to set their assumptions of how mortality rates will change in future or as a “common language” to communicate assumptions that have been set by another method.
How does the CMI Model work?
The CMI Model enables actuaries to project mortality improvements. They can then apply these improvements to any mortality table to get future mortality rates.
The CMI Model makes its projections by blending between short-term and long-term improvements:
- The short-term improvements are based on historical mortality data. The CMI Model smooths the data, to reduce the effect of short-term volatility, and estimates current mortality improvements by age and gender. The CMI encourages users of the CMI Model to consider adjusting the initial improvements to reflect the portfolio that they are applying it to.
- The long-term improvements are set by assumption, rather than being based on data. As the CMI does not make an assumption for long-term mortality improvements, users need to make their own assessment of the long term. The CMI Model is therefore a framework for mortality assumptions, rather than giving a single answer, as different users will have different opinions of long-term improvements, and use different methods to form their views.
What mortality data does the CMI Model use?
The CMI Model is based on data for the general population of England & Wales, published by the ONS, but we make a number of estimates and adjustments:
- We adjust the population size at ages 85 and above, and at younger ages where we consider the implied mortality rates to be implausible.
- We make our own estimates of the population for the final year of data, as the official ONS figures are not available when we update the CMI Model.
Why does the CMI Model use ONS data for England & Wales?
We use population data, rather than datasets collected by the CMI, in order to have a large and consistent dataset over a long period of time.
We use data for England & Wales, rather than the UK, because the relevant data becomes available sooner for England & Wales, so we can keep the CMI Model more up-to-date. We regularly look at results using data for the whole UK and, to date, have found that they are little different from results that only rely on data for England & Wales. We generally expect this to be the case as even though significant differences in mortality between the nations are sometimes observed in some years, the bulk of the UK’s population live in England & Wales.
Why is the CMI Model updated?
The CMI Model was introduced in 2009 and has been regularly updated since then:
- We update it annually to take account of mortality data for the most recent calendar year.
- We make occasional changes to the way the CMI Model works to reflect evolving thinking on the most appropriate methodologies. For example:
- In CMI_2016 we revised the approach to estimate initial mortality improvements from historical data.
- In CMI_2018 we introduced the initial addition to mortality improvements, to help users to tailor the CMI Model to their portfolios, and reduced the period smoothing parameter.
- In CMI_2020 we introduced the ability to place little or no weight on mortality data for exceptional years.
4. Mortality terminology
What is a mortality rate?
A mortality rate is the proportion of people that are expected to die in the following year. For example, if 100 of every 1,000 85-year old males die within a year, then the mortality rate for males at age 85 is 10%.
Mortality rates vary by factors including age, gender and socio-economic status; in particular, mortality rates tend to be higher at older ages.
What is a mortality table?
A mortality table is a set of mortality rates for each age, for a particular group of people at a point in time. Mortality tables are usually based on historical data over a number of years, to smooth out short-term volatility. For example, the CMI’s “S4” mortality tables are for pension scheme members in 2014 to 2019.
What is a standardised mortality rate?
Because mortality rates are higher at older ages, changes in the age distribution of a population can lead to apparent changes in average mortality rates, even if mortality rates at each age do not change. A standardised mortality rate (SMR) can be thought of an average mortality rate for a group of lives, assuming that it has a standard age profile. This enables us to make a consistent comparison of mortality rates over time and between groups. We use the age profile of the 2013 European Standard Population for ages 20 to 100.
What is a mortality improvement?
A mortality improvement measures the reduction in mortality rates from one year to the next. Actuaries usually refer to “improvements” rather than “changes” because mortality rates have tended to fall over the long term. A positive improvement represents a fall in mortality rates. A negative improvement represents a rise in mortality rates.
For example, if:
- Last year, 100 of every 1,000 85-year old males died within a year (a mortality rate of 10%).
- This year, only 98 of every 1,000 85-year old males die within a year (a mortality rate of 9.8%).
Then this year’s mortality improvement for 85-year old males is +2%, as there are 2% fewer deaths than in the previous year.
What are period and cohort life expectancies?
Life expectancy is a measure of how much longer, on average, a person in a particular group (by age, gender etc) is expected to live. For example, if females aged 65 have a life expectancy of 25 years, then they are expected to live to 90 on average. Individuals within the group could have much shorter or longer lives.
There are two distinct types of life expectancy, which measure different things:
- Period life expectancy takes no account of future mortality improvements, only historical data. This means that it is an objective measure for comparing mortality between populations and over time, but it isn’t a realistic assessment of how long people may actually live.
- Cohort life expectancy does take account of expected future changes in mortality. This makes it useful to actuaries who need to make realistic assumptions about what may happen in the future. Consequently, the CMI tends to focus on cohort life expectancy. However because future changes in mortality are unknown, cohort life expectancy is subjective, and different actuaries will have different views of cohort life expectancy
Disclaimer: The content of this page has been prepared by and/or on behalf of Continuous Mortality Investigation Limited (CMI). The CMI does not accept any responsibility and/or liability whatsoever for the content or its use. Whilst care has been taken during the development of the content, CMI does not (i) warrant its accuracy; or (ii) guarantee any outcome or result from the application of this content or of any of CMI’s work (whether contained in or arising from the application of this content or otherwise). You assume sole responsibility for your use of this content, and for any and all conclusions drawn from its use. CMI hereby excludes all warranties, representations, conditions and all other terms of any kind whatsoever implied by statute or common law in relation to this content, to the fullest extent permitted by applicable law.
If you are in any doubt as to using anything produced by CMI, please seek independent advice.
Copyright: You may reproduce the contents of this page in any format or medium provided it is:
1. reproduced accurately and is unaltered;
2. not used in a misleading context; and
3. correctly referenced and includes both CMI’s Disclaimer notice set out above and CMI’s copyright notice, as follows:
© Continuous Mortality Investigation Limited.
Continuous Mortality Investigation Limited (“CMI”) is registered in England & Wales
Company number: 8373631
Registered Office: 1-3 Staple Inn Hall, High Holborn, London, WC1V 7QJ
Correspondence address: Two London Wall Place, 123 London Wall, London, EC2Y 5AU
Email: info@cmilimited.co.uk
Tel: 020 7776 3820
Website: www.cmilimited.co.uk
Continuous Mortality Investigation Limited is wholly owned by the Institute and Faculty of Actuaries.
Events calendar
No results found.